Sales Reports
You can view your company's sales performance, analyze sales data in different views to see the sales performance. With filters, you can dynamically change what is displayed. There are three window areas that make up the Sales Analytics Report-The Filter Toolbar Window, the Graph Window and the Data Window shown as follows:
These analytics can be found under:
Home > Selling > Key Reports
1. Sales Analytics Report
Go to Selling > Analytics > Sales Analytics. The Sales Analytics report looks like this:
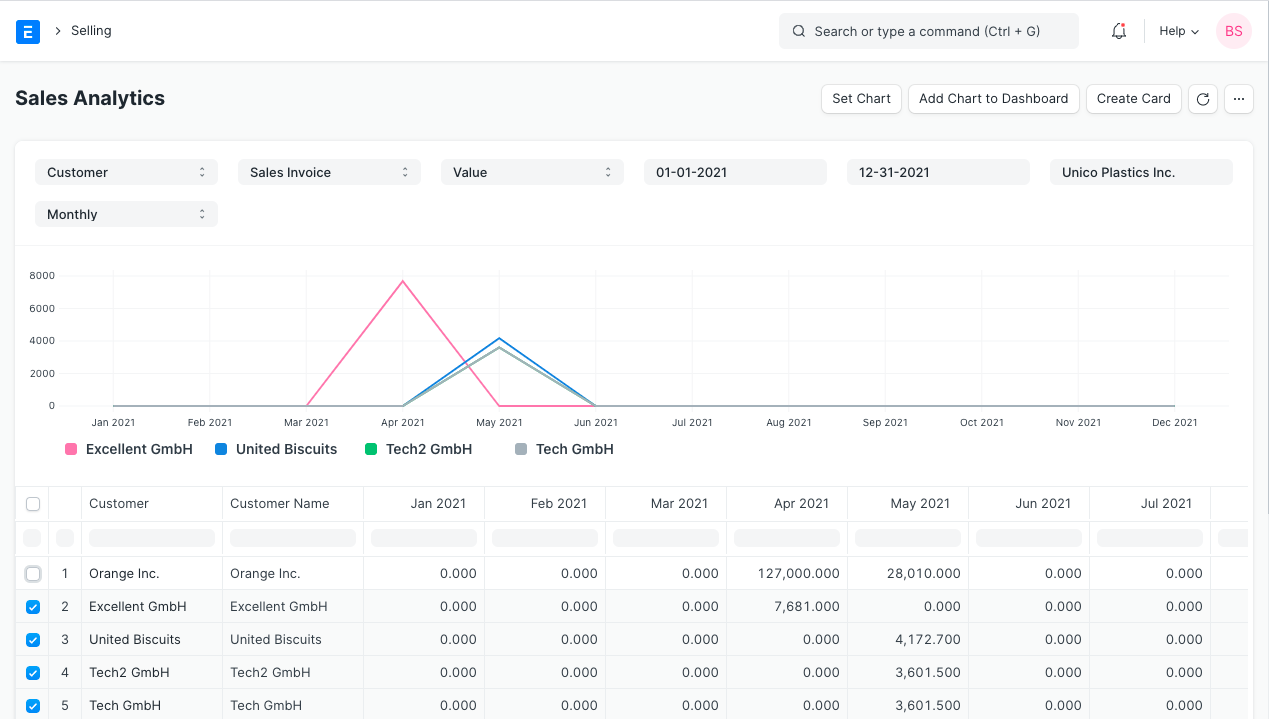
The toolbar provides filters to select what data is to be used. Using the dropdown selections, the data displayed can be refined. As the selections are made, data is reflected in the data window as well as the graph window.
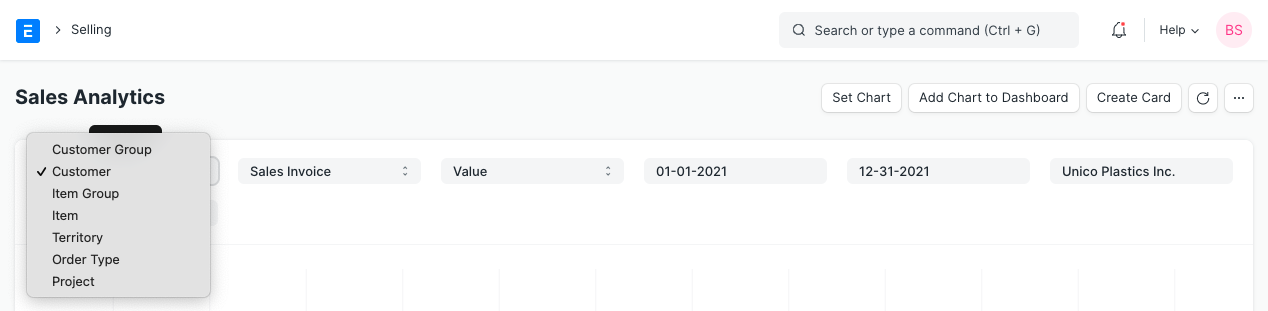
Within the data window, selections can be made to expand or compress the data to be analyzed. Each box can be selected or unselected. There is no restriction for data comparison, so a higher level can be compared to a lower level.
Using the 'Set Chart' button, you can set values for the X and Y fields, use different type of charts and select a color.
2. Sales Funnel Report
Go to Selling > Analytics. The report "Sales Funnel" provides a sales generation analysis. It displays the progression of stages in the sales process. There are four stages leading up to a Sales Order: Active Leads, Opportunities, Quotations and Converted (has become a Customer).
- Active Leads shows the number of all your Leads, including all the other stages.
- Opportunities shows the number of Leads for which an Opportunity was created.
- Quotation shows the number of leads for which a Quotation was submitted.
- Converted shows the number of leads for which a Quotation and Sales Order was submitted.
The earlier stages usually include the later stages. However, if an earlier stage was skipped, you might see counterintuitive results like two Quotations resulting from one Opportunity (because it is not mandatory to create an Opportunity first).
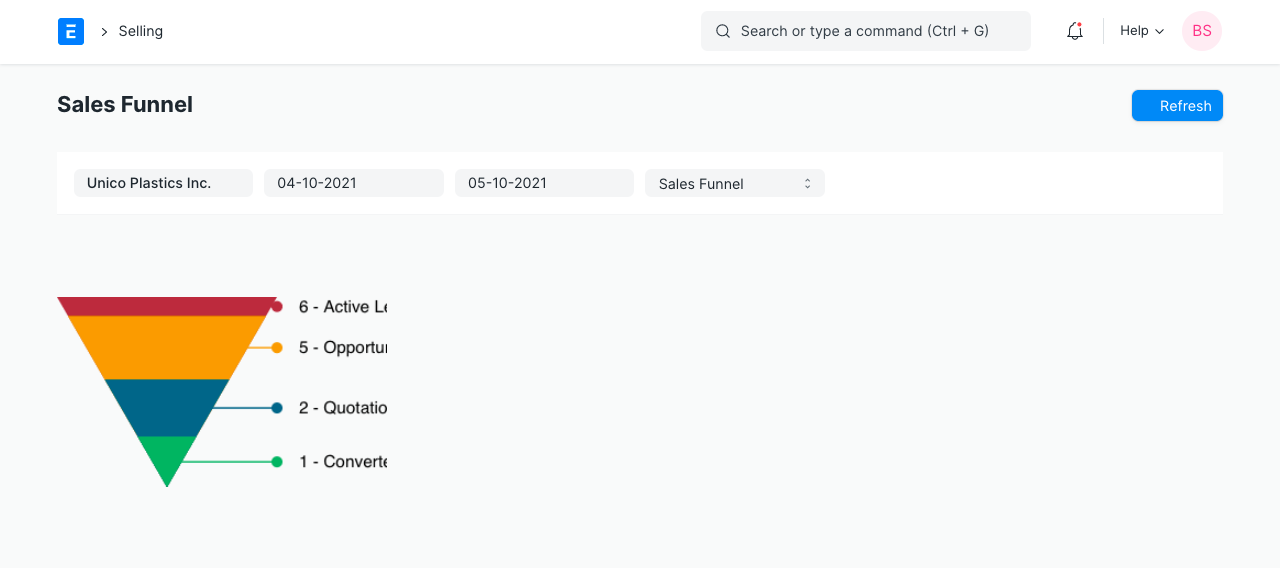
Once a date range has been selected, the graph is updated, the graph reflects the changes and the associated labels.
3. Customer Acquisition and Loyalty Report
Go to Selling > Analytics. To understand revenue, it's often helpful to look at the data from a new customer and existing customers standpoint. This report helps visualize customer loyalty. There are two windows within this report: The Filter Window and the Data Window.
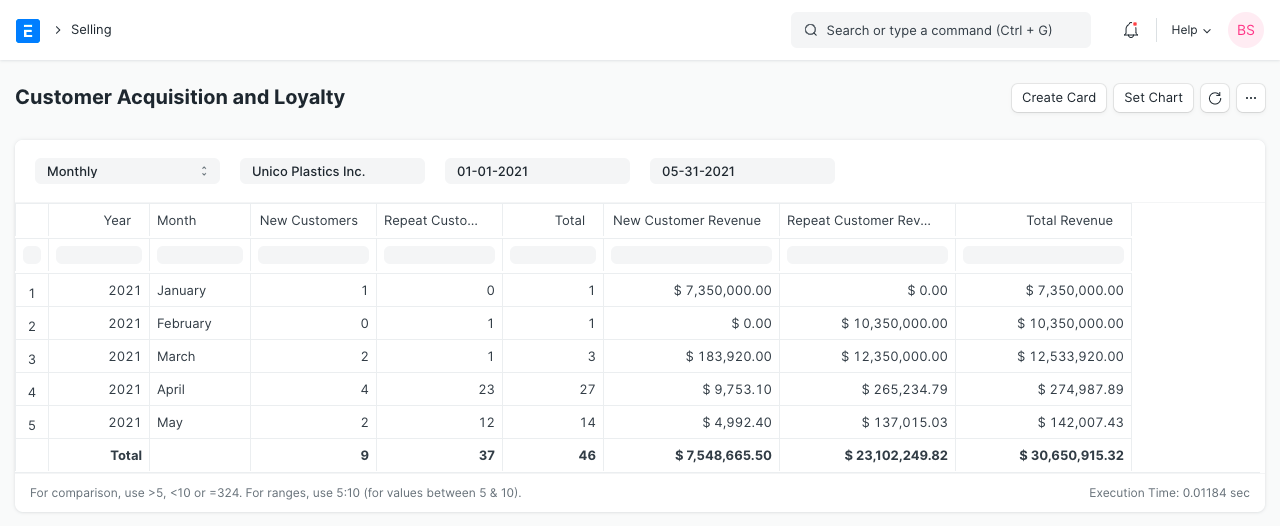
Accessing the Filter Window, the company and date ranges can be applied. Data is updated in the Data Window as changes are applied.
Within the Data Window, columns of information are accessible.
- Moving columns: The columns can be moved, re-arranged by clicking on the column headings and dragging them.
- Sorting: To sort the data in columns, click on the right-hand side of a column heading and you'll see options to sort as ascending, descending, reset sorting, or remove a column.
- Filtering: The text boxes below the column headings work as instant filters. Enter a number there and all matching records will be shown.
Under Key Reports there are reports for Inactive Customers, Ordered Items To Be Delivered, Sales Person-wise Transaction Summary, Item-wise Sales History, Quotation Trends, Sales Order Trends in the Selling module.
In the Other Reports section there are reports for the following:
- Lead Details
- Customer Addresses And Contacts
- BOM Search
- Available Stock for Packing Items
- Pending SO Items For Purchase Request
- Customer Credit Balance
- Customers Without Any Sales Transactions
- Sales Partners Commission