Forecasting Using Exponential Smoothing
To access the Forecating Report, go to:
Home > Manufacturing > Reports > Forecasting
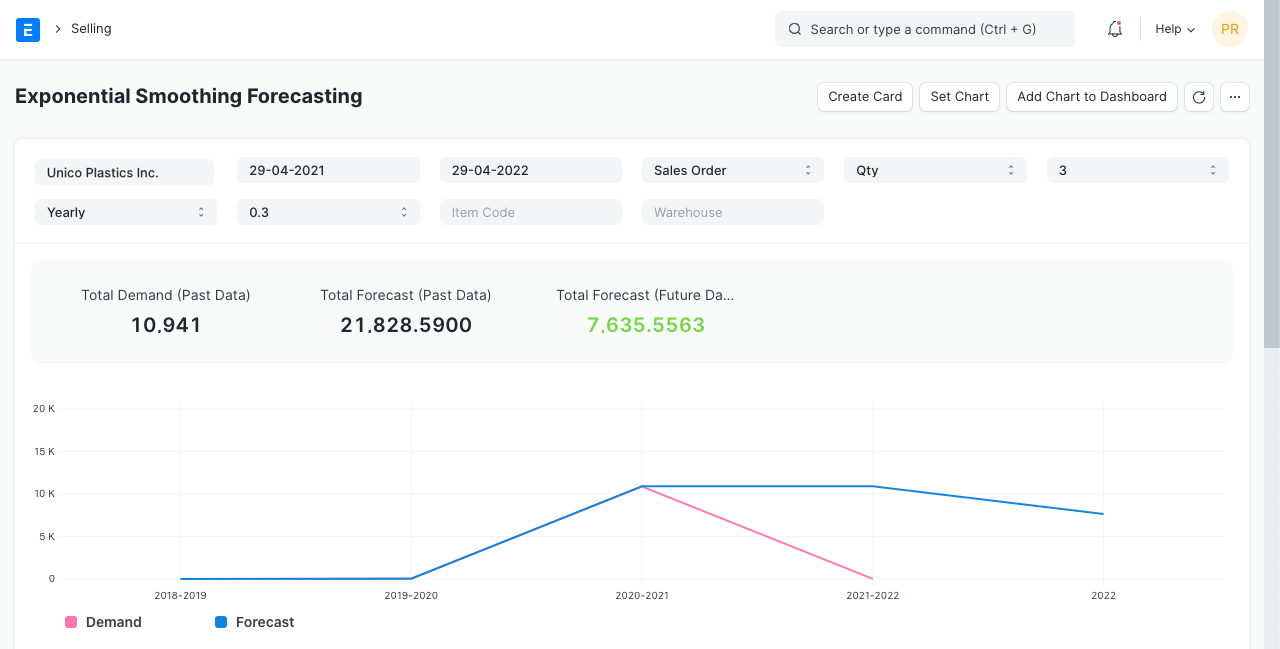
Using exponential smoothing method and past Sales Order / Delivery Note / Quotation data, the forecasting will be calculated. The exponential smoothing method formula is as below:
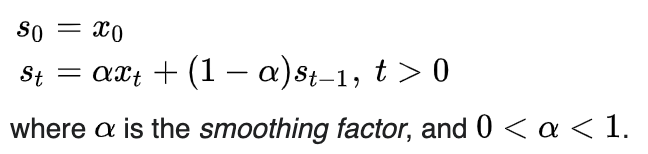
Using exponential smoothing method, system predicts the forecasting for each period and same forecast data will be used to forecast the upcoming period data.
How does the exponential smoothing method works
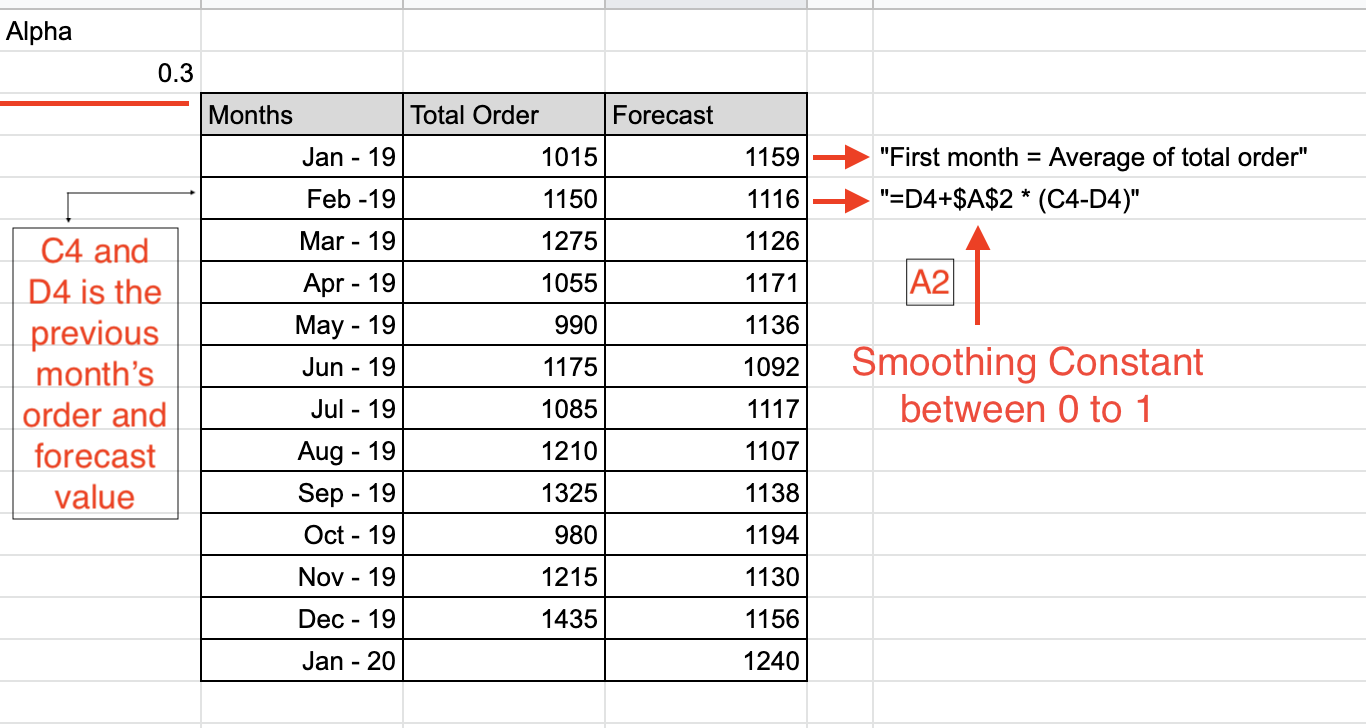
For the above example, we have used one-year sales order data every month. The first-month forecast will be calculated based on the average of all total orders. From the second month onward, the difference between the last month's Total Order and Forecast Value will be multiplied with the Smoothing Constant Value (in between 0 to 1). The default value of the Smoothing Constant is 0.3 which gives efficient forecasting data. The last month's Total Order and Forecast Value difference called forecasting error and this error will be added in the same month of forecast value to calculate the forecast of the next month.
How do the filters work
- Company :- user can do forecasting for the specific company by applying the company filter
- From Date and To Date :- for this period system will do the forecasting, the default from date is the current date and to date will be the one year ahead date from the current date.
- Based On Document :- by default system uses sales order past data to forecast. User can select the other document like delivery note / quotation to forecast the data.
- Based On :- based on quantity / amount system shows the forecast data.
- Based On Data ( in years ) :- for forecasting requires past data, this filter helps system to check past data for number of years.
- Periodicity :- forecasting data can be viewed in Monthly / Quarterly / Half-Yearly / Yearly basis, the old forecast data can not be displayed for Monthly period for better view.
- Smoothing Constant - the Smoothing Constant will be used to forecast the data, the value should be between 0 and 1.