CRM Analytics
For example, if you notice that very few communications with the prospects have taken place in a month which may have led to decrease in the sales. You can make sure that the sales executives reach out and followup on the leads and opportunities on regular basis.
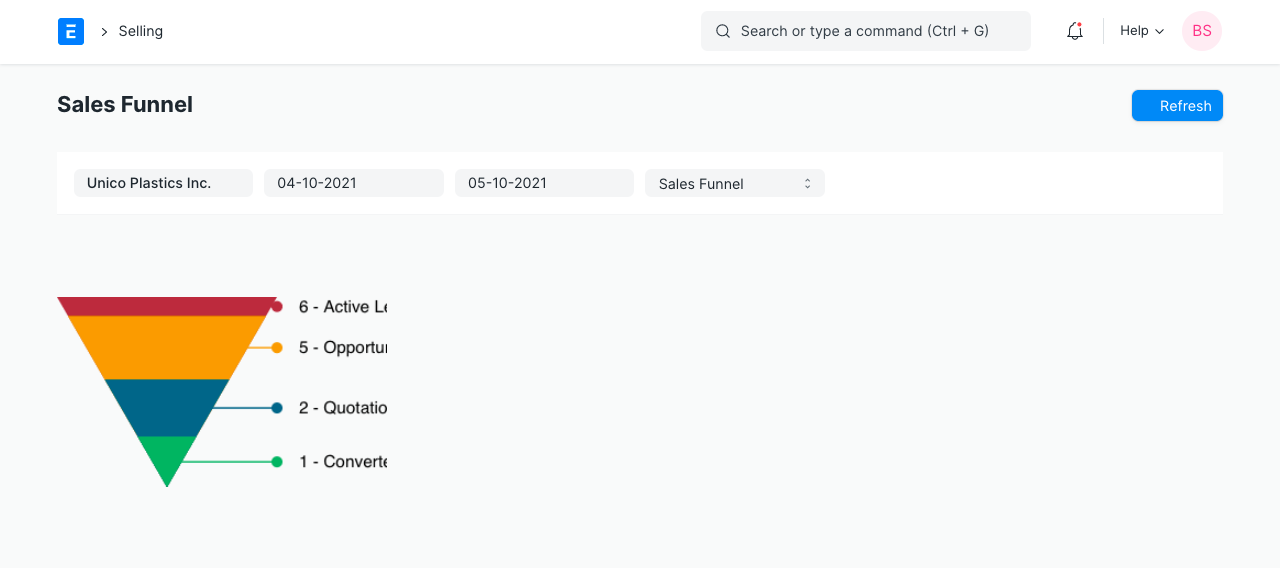
1. Sales Funnel
By using the sales funnel report, you can quantify the number of prospects at each stage of the process and you can get an idea of your potential customers.
More than this, by looking at the way these numbers change over time, you can identify problems in the sales pipeline and take any corrective action at an early stage.
Select the Company, select the From Date, To Date and select Sales Funnel in Chart.
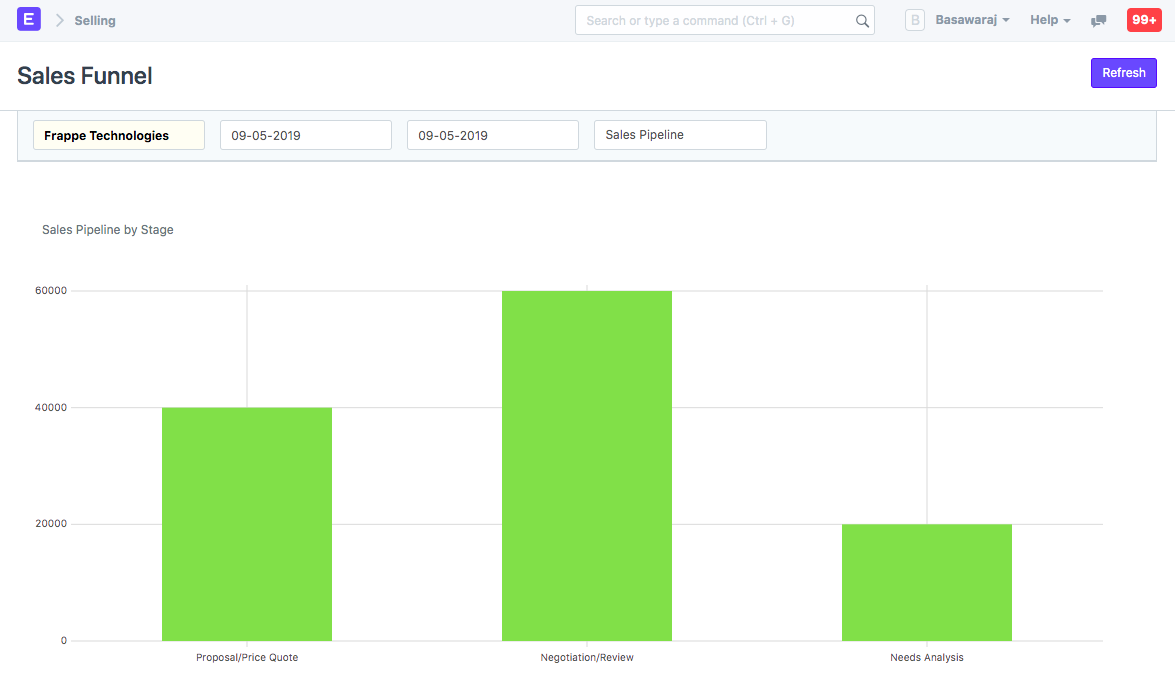
2. Sales Pipeline
An opportunity will pass through many sales stages before it yields any business. Using this report you can visualise the total amount of business the opportunities have and compare them across the stages.
Select the Company, select the From Date, To Date and select Sales Pipeline in Chart.
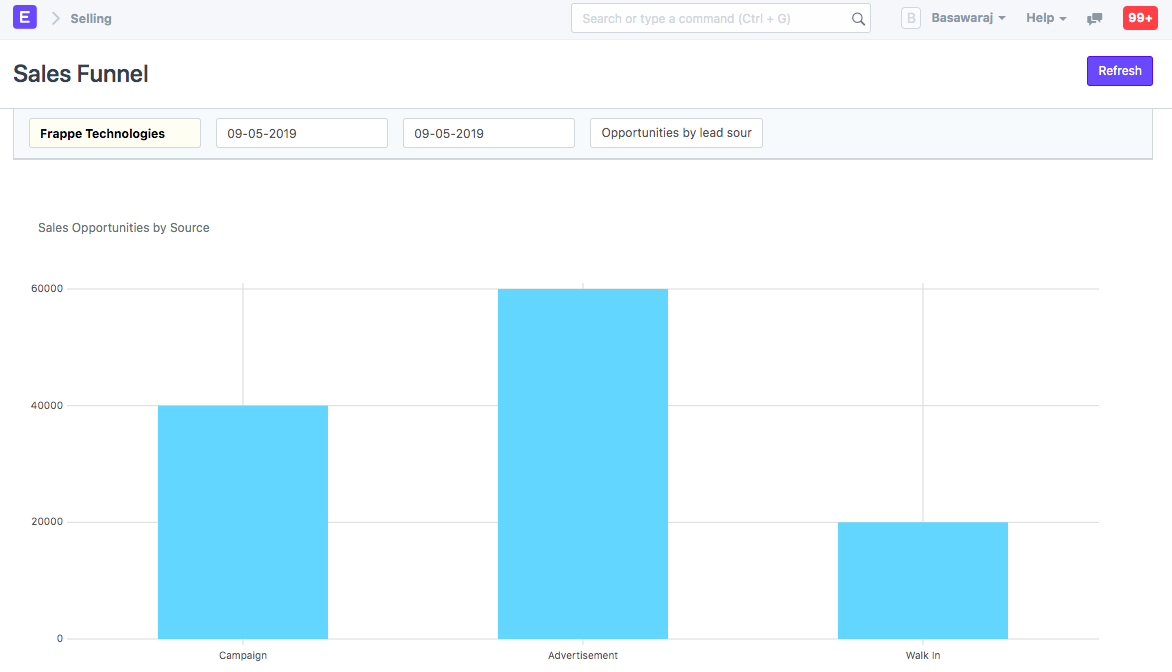
3. Opportunities by Lead Source
This report helps you visualise the business potential of opportunities based on the Lead Sources.
Select the Company, select the From Date, To Date and select 'Opportunities by Lead Source' in Chart.