Accounting Reports
Some of the major accounting reports are:
1. Company and Accounts
General Ledger
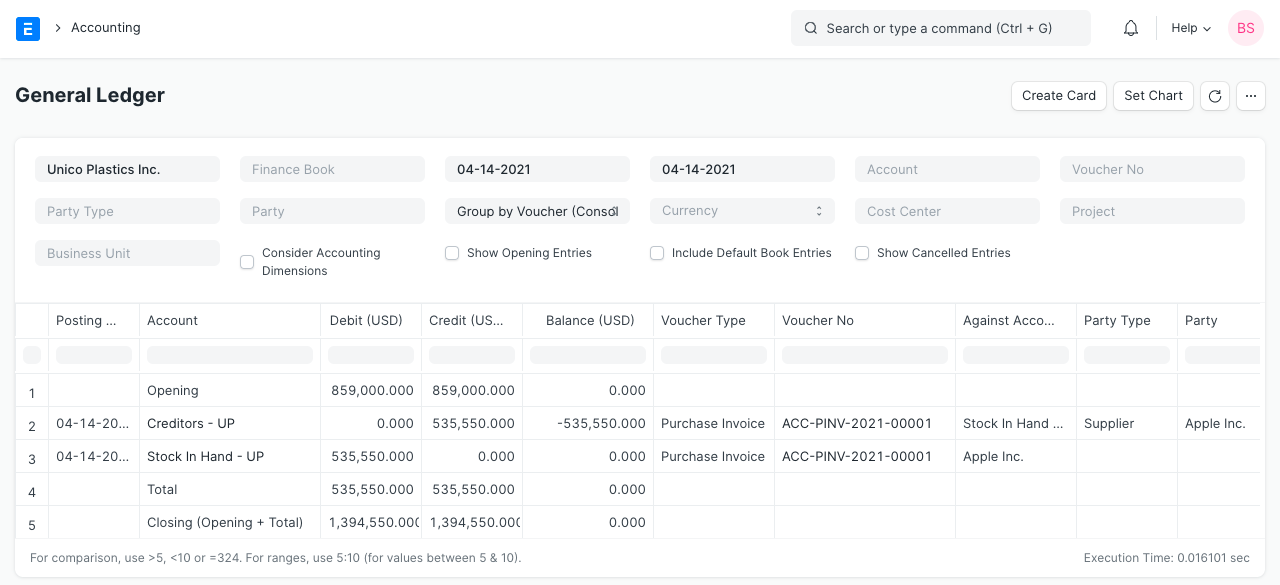
Go to: Accounts > Company and Accounts > General Ledger.
The General Ledger is a detailed report for all transactions posted to each account and for every transaction there is a Credit and Debit account so it lists them all up.
The report is based on the table GL Entry and can be filtered by many pre-defined filters like Account, Cost Centers, Party, Project and Period etc. This helps you to get a full update for all entries posted in a period against any account. The result can be grouped by Account, Voucher/Transaction and Party with opening and closing balances for each group. In case of multi-currency accounting, there is also an option to check the amounts in any other currency than company's base currency.
2. Accounting Statements
2.1 Accounts Receivable and Accounts Payable (AR / AP)
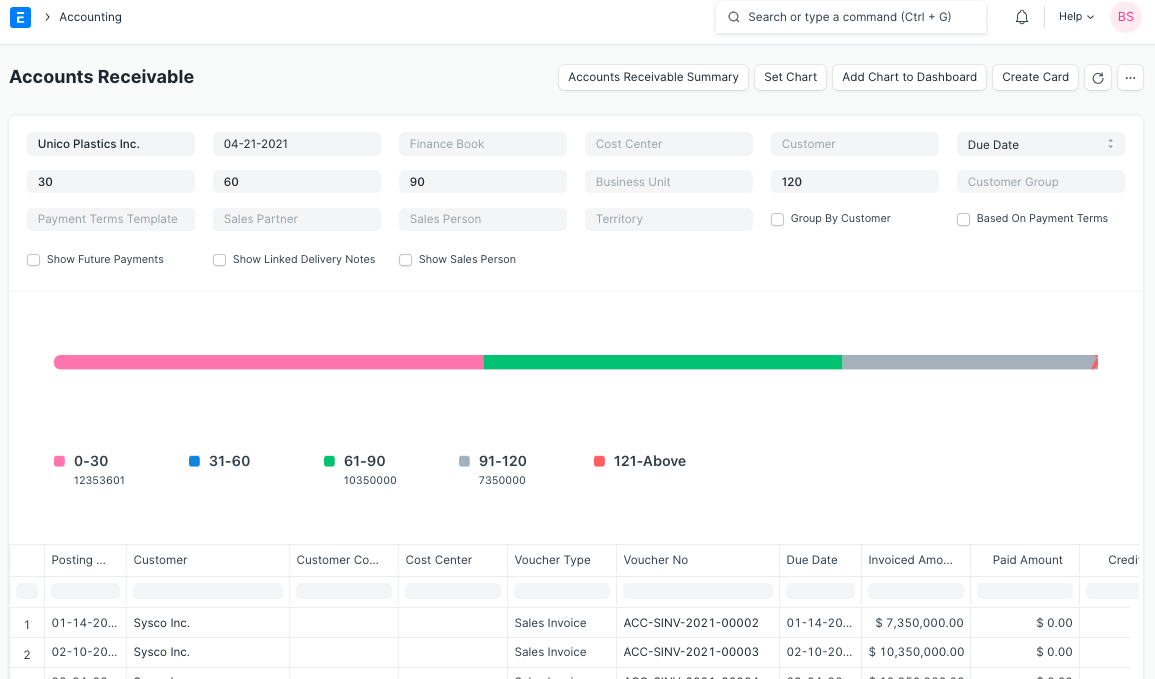
Go to: Accounts > Accounting Statements > Accounts Receivable.
These reports help you to track the outstanding amount of Customers and Suppliers. It also provides ageing analysis i.e. a break-up of outstanding amount based on the period for which the amount is outstanding.
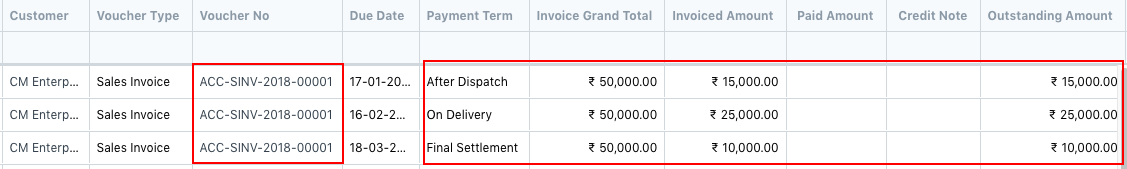
2.1.1 Accounts Receivables based on Payment terms
You can also see Accounts Receivables based on Payment Terms.
Accounts Receivable report based on payment terms can be seen by clicking the checkbox 'Based On Payment Terms' as shown in the following screenshot.
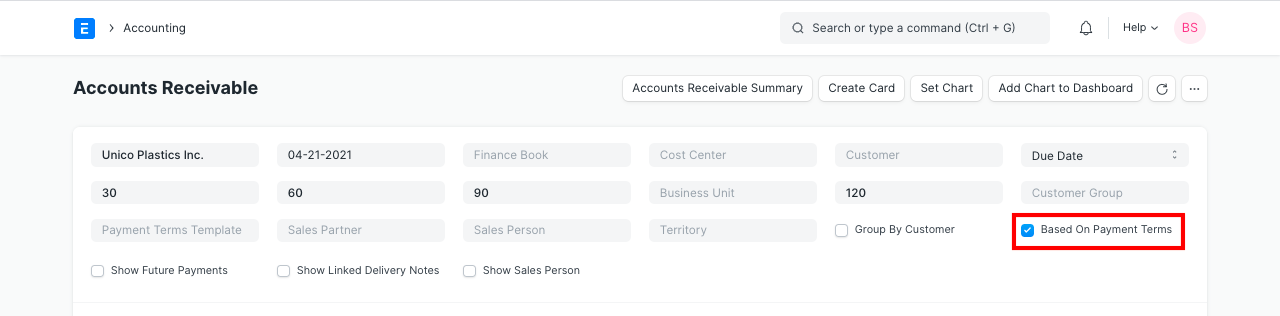
Outstanding amount against each payment term can be seen. Invoiced Amount shows each payment term amount and Paid Amount shows paid amount against each payment term. Payment against each term is allocated in FIFO order.

2.1.2 'Revaluation Journals' filter on Accounts Receivable/Payable
'Revaluation Journals' filter allows the report to accurately report Invoice outstandings where currency conversion differences for parties are handled by Exchange Rate Revaluation journals. Only applicable, if there is heavy usage of Multi-Currency transactions and Exchange Rate Revaluation.
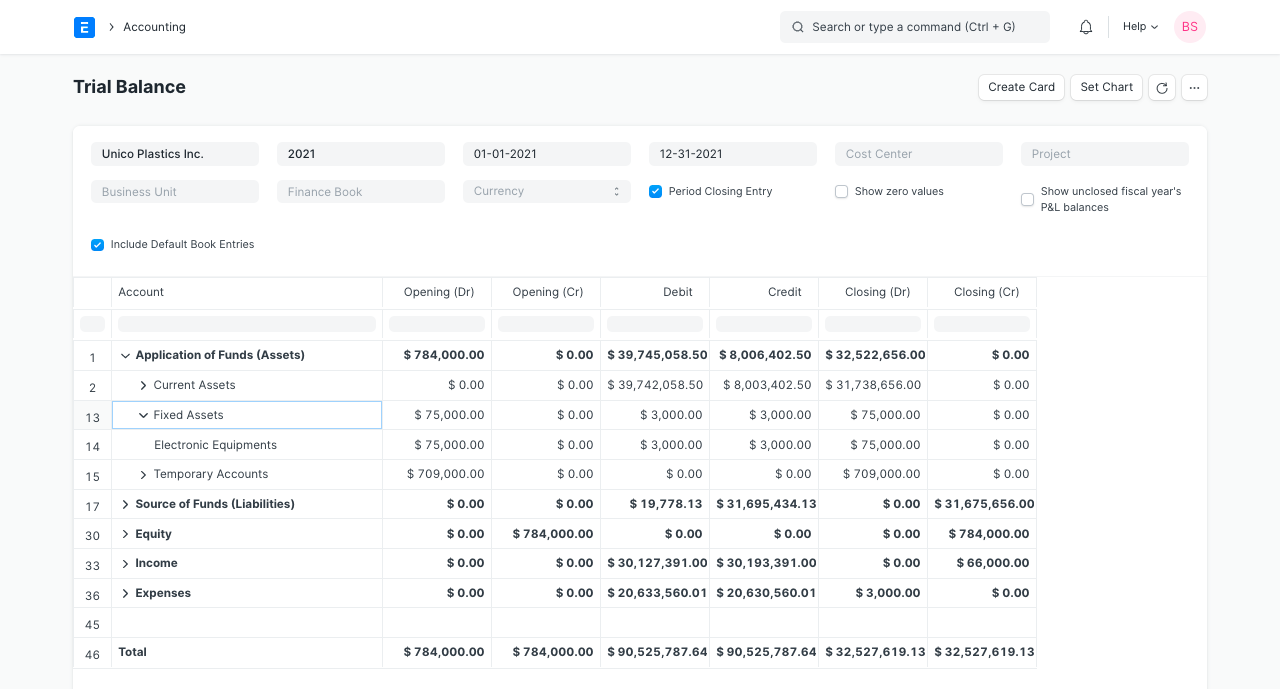
2.2 Trial Balance
Go to: Accounts > Accounting Statements > Trial Balance.
A Trial Balance is an accounting report which lists account balances for all your Accounts (“Ledger” and “Group”) for any given reporting period. A company prepares a trial balance periodically, usually at the end of every reporting period. The general purpose of producing a trial balance is to ensure the entries in a company's bookkeeping system are mathematically correct. The totals of Debit and Credit columns must be same for any given period, to ensure the entries are correct. In ERPNext, the report shows following columns:
- Opening (Dr): Opening debit balance as on From Date
- Opening (Cr): Opening credit balance as on From Date
- Debit: Total Debited amount against the account between the selected period
- Credit: Total Credited amount against the account between the selected period
- Closing (Dr): Closing debit balance as on To Date
- Closing (Cr): Closing credit balance as on To Date
There are some other options as well to include or exclude Period Closing Entries, show / hide accounts with zero balance and to show unclosed previous fiscal year's P&L (Income & Expenses) balances. All the figures in the report are shown in company's base currency.
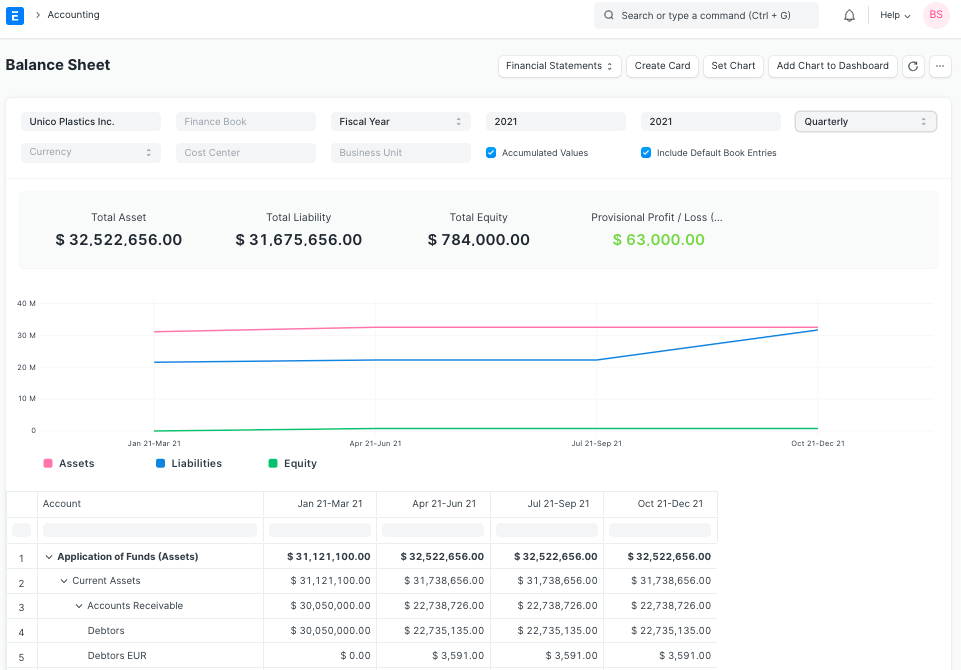
2.3 Balance Sheet
Go to: Accounts > Accounting Statements > Balance Sheet.
A Balance Sheet is the financial statement of a company which states assets, liabilities and equity at a particular point in time.
The Balance Sheet in ERPNext gives you more flexibility to analyse your financial position. You can run the report across multiple year to compare values. You can check values for a specific Finance Book or Cost Center. You can also choose any other currency to display the balances.
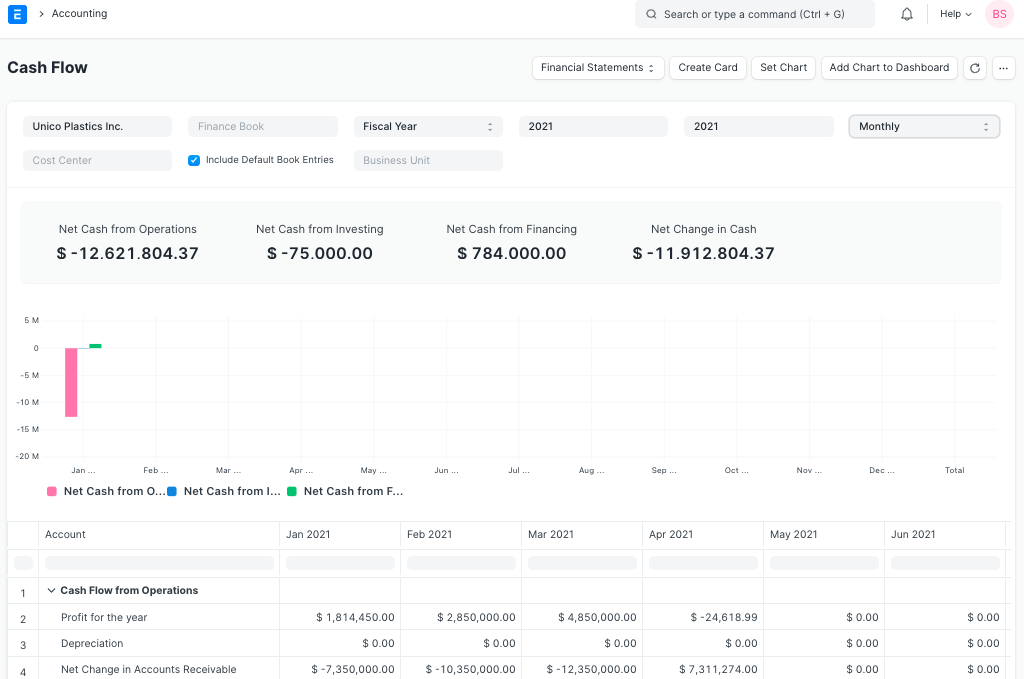
2.4 Cash Flow Statement
Go to: Accounts > Accounting Statements > Cash Flow.
A Cash Flow is a financial statement which shows the incoming and outgoing of cash or cash-equivalents for a company. It is used to analyse the liquidity position of the company.
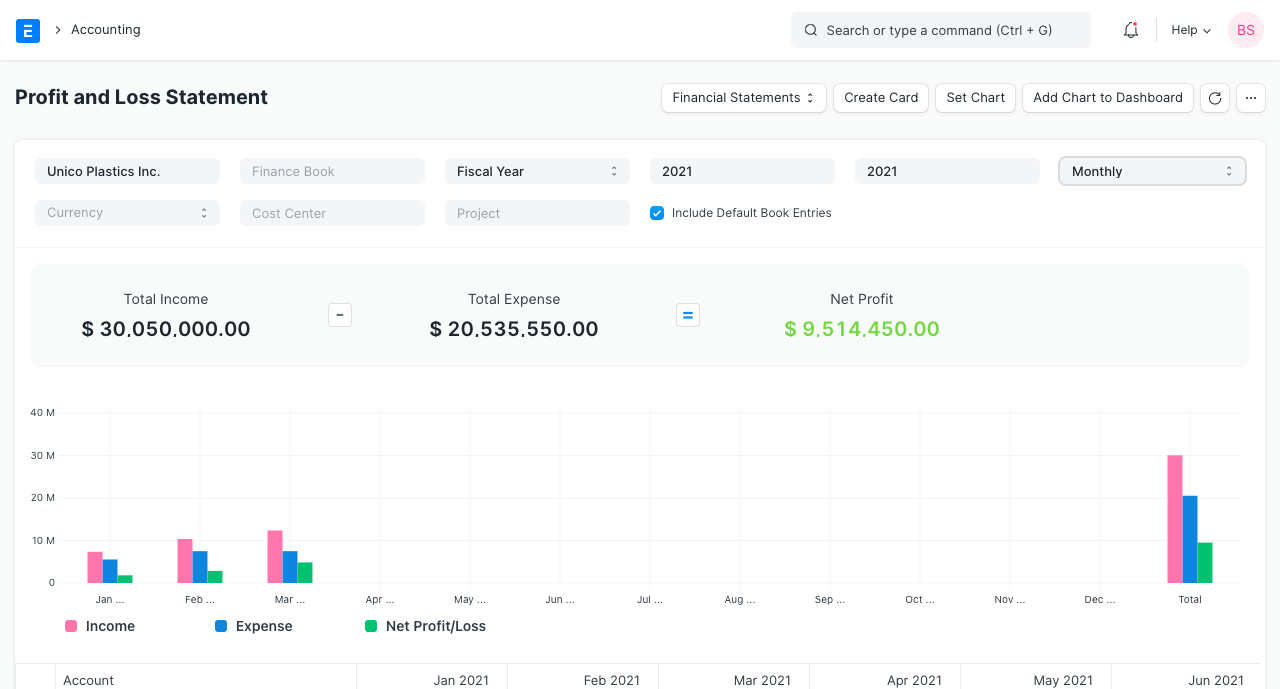
2.5 Profit and Loss Statement
Go to: Accounts > Accounting Statements > Profit and Loss Statement.
A Profit and Loss Statement is a financial statement which summarizes all the revenues and expenses in a given period. The report is also known as P&L Statement.
In ERPNext, you can run the report across multiple year / period to compare the values. You can also check values for a specific Finance Book, Project or Cost Center. You can also choose any other currency to display the balances. If you are running the report to see quarterly / monthly balances, you can choose whether you want to show accumulated balances or only for each period.
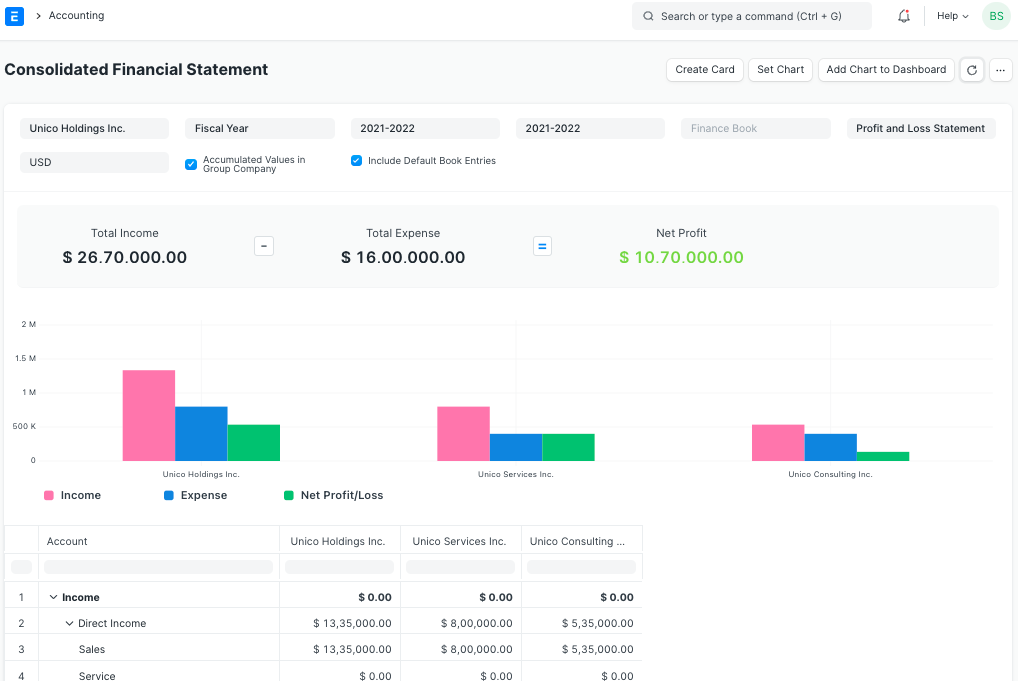
2.6 Consolidated Financial Statements
Go to: Accounts > Accounting Statements > Consolidated Financial Statement.
The report shows a consolidated view of Balance Sheet, Profit and Loss Statement and Cash Flow for a group company, by merging financial statements of all the subsidary companies. It shows balances for all individual company and as well as accumulated balances for a group company.
2.7 Financial Ratios Report
Introduction
A financial ratio is a measurement tool used to evaluate a company's financial condition or performance relative to other businesses. This tool is commonly used by investors to study and obtain insight about a company's financial history or the overall industry. The process of computing a financial ratio involves extracting numbers from the balance sheet, income statement, and cash flow statement. Rather than just being a calculation, a financial ratio offers an understanding of a company's economic status in areas such as profitability, liquidity, leverage, and market valuation. A ratio can act as a signal, alert, or hint towards various potential issues.
Assumptions
- Net Sales = Direct Income
- Credit Sales = Direct Income
- Credit Purchases = Direct Expense
- Share Holder Fund (SHF) = Total Asset - Total_Liability
- Net Profit After Income & Taxes(NPAIT) = Total Income - Total Expense
Types of Ratios:
2.7.1 Liquidity Ratios
Consists of:
2.7.1.1 Current Ratio = Current Assets/Current Liability
2.7.1.2 Quick Ratio = Quick Assets/Quick Liability
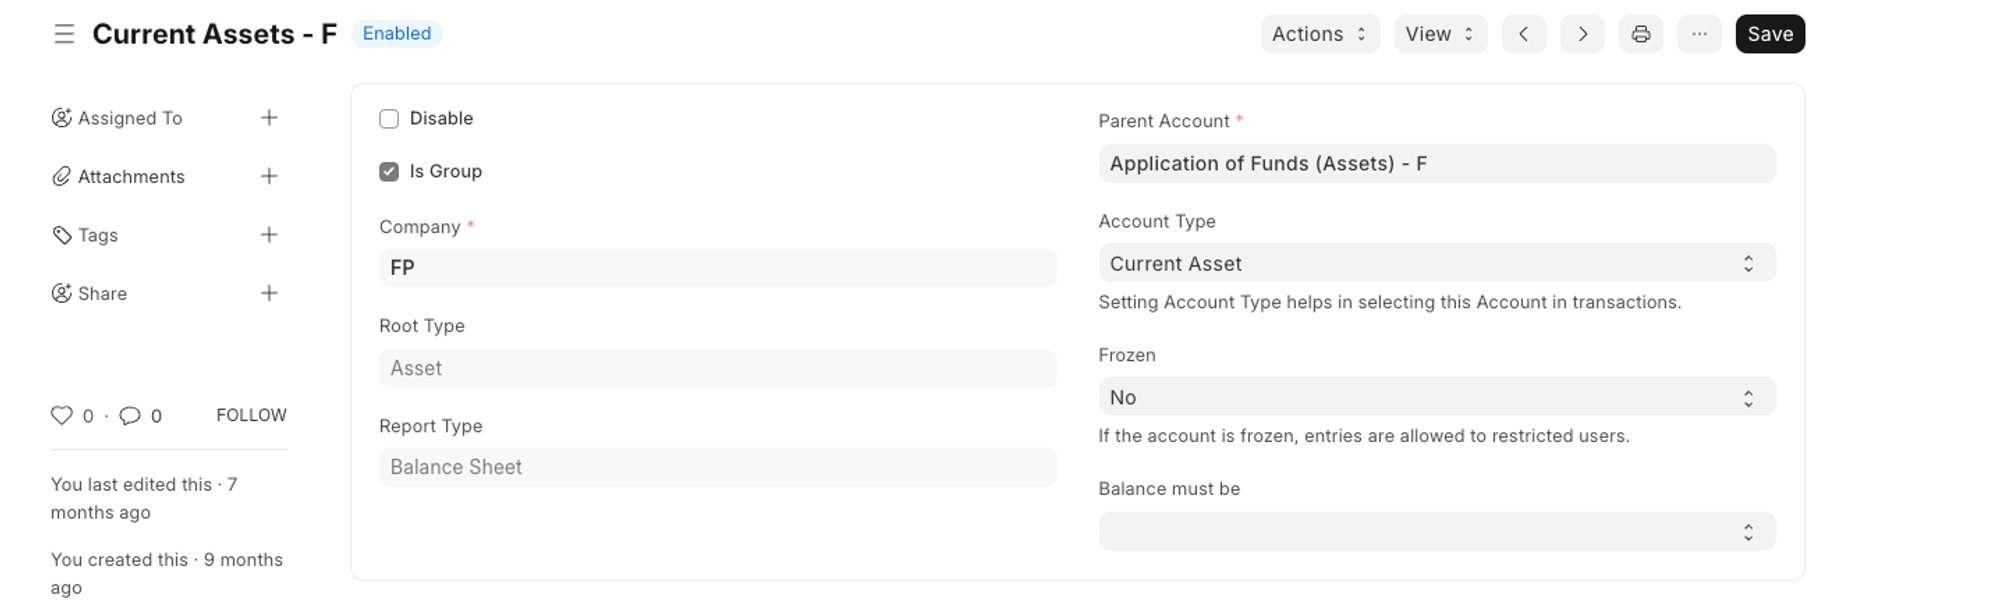
Requires 2 types of accounts:
- Current Asset(e.g)
 2. Current Liability(e.g)
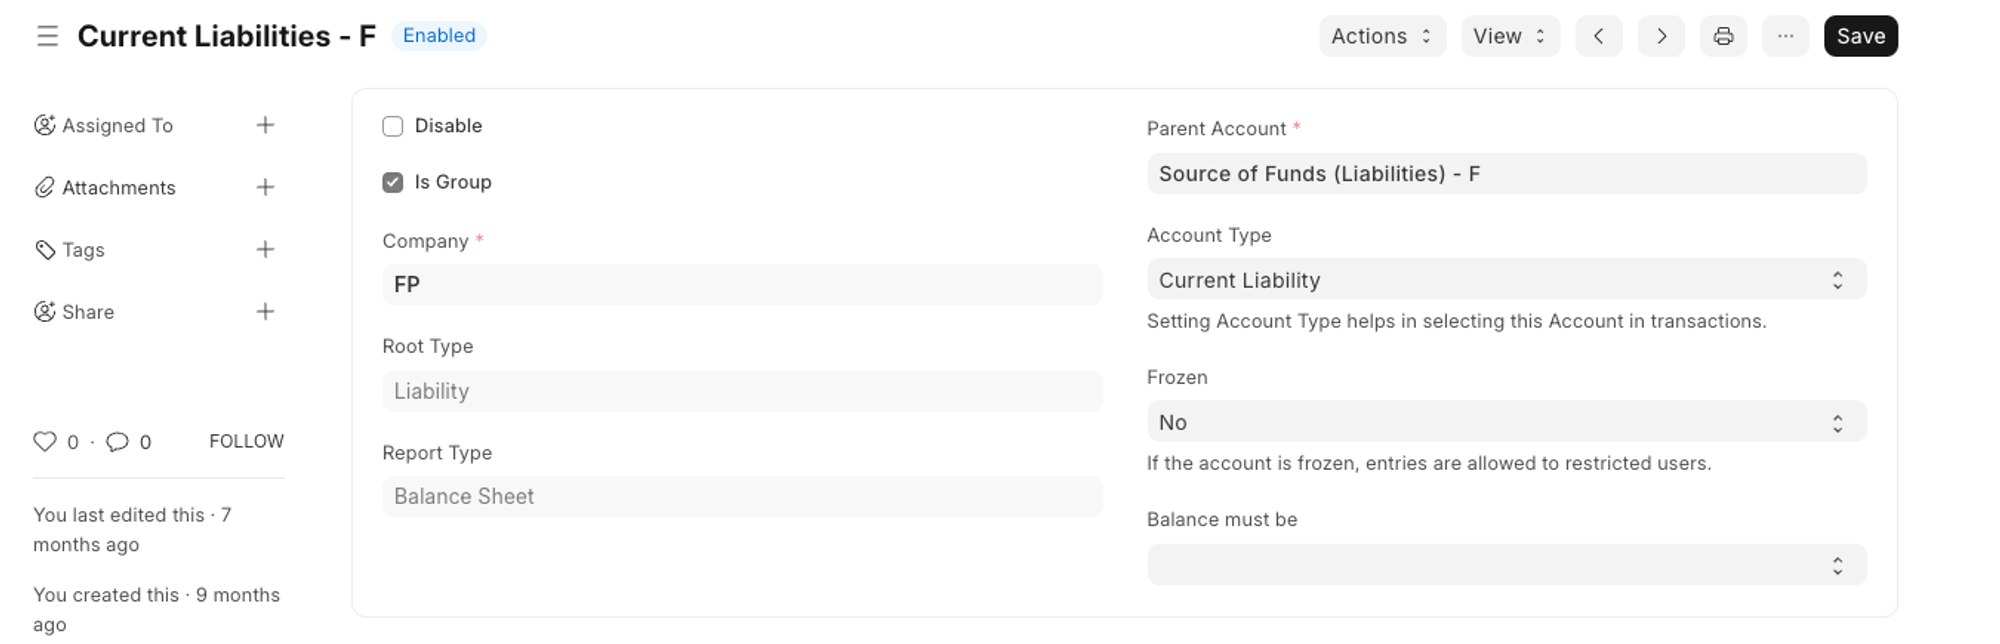
As soon as you will set your account types for the relevant account in your “Chart of Accounts”, both Current Ratio and Quick Ratio will show the correct value.
2.7.2 Debt Equity Ratios
Consists of:
2.7.2.1 Debt Equity Ratio = Total Liability / SHF
2.7.2.2 Gross Profit Ratio = (Net Sales - COGS)/Net Sales
2.7.2.3 Net Profit Ratio = NPAIT /Net Sales
2.7.2.4 Return on Asset Ratio = NPAIT/Total Assets
2.7.2.5 Return on Equity Ratio = NPAIT/SHF
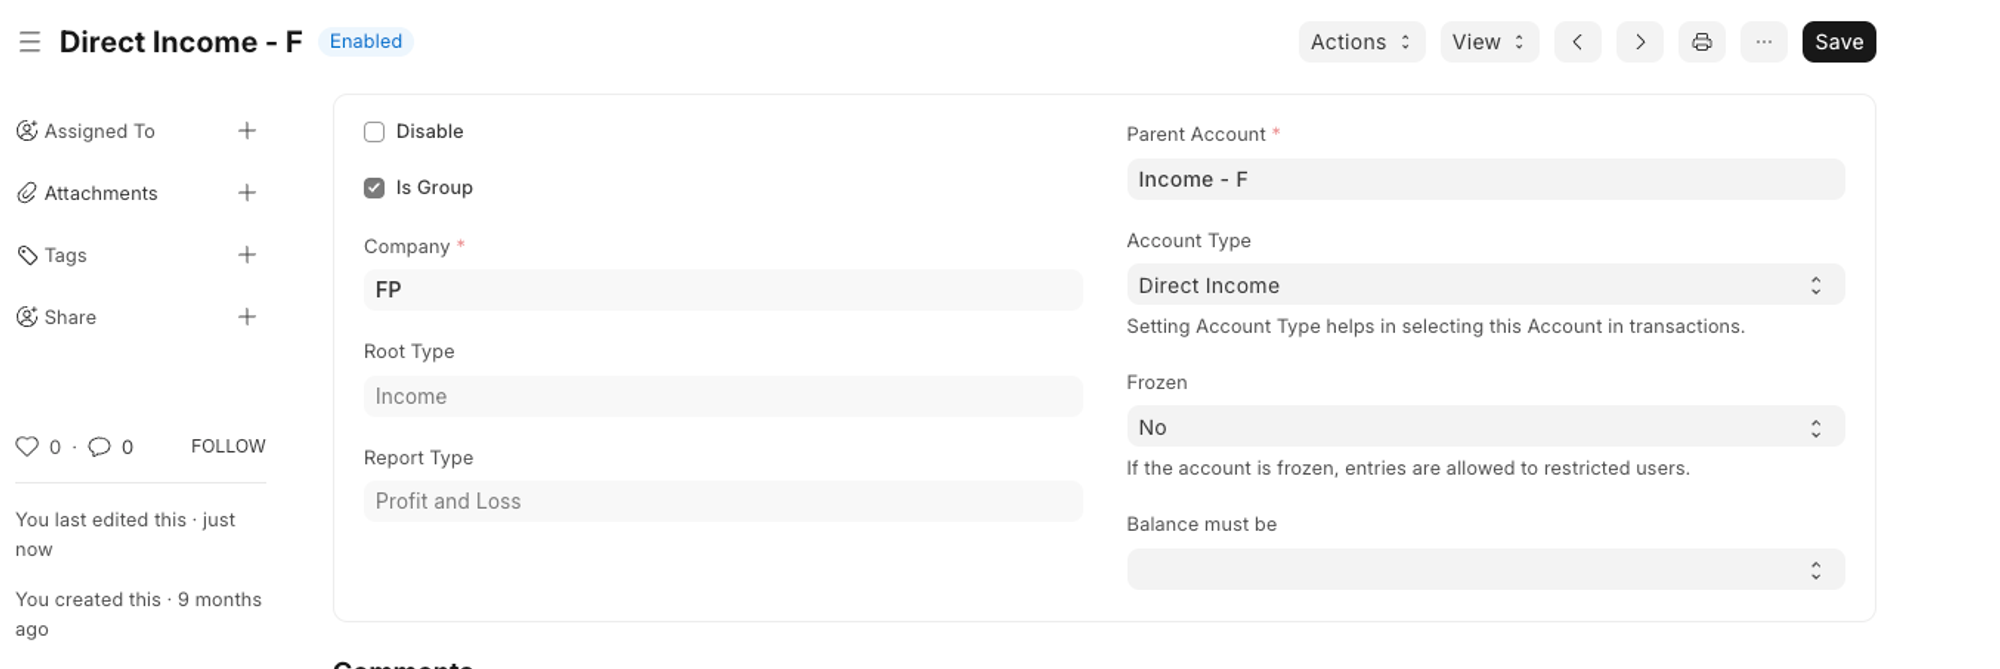
For Gross Profit Ratio and Net Profit Ratio to show the correct data we need to add the relevant account type to “Direct Income” (as direct income is treated as Net Sales). (e.g.)
2.7.3 Turnover Ratios
Consists of:
2.7.3.1 Fixed Asset Turnover Ratio = COGS/ Avg. Stock
2.7.3.2 Debtor Turnover Ratio = Credit Sales / Avg. Debtors
2.7.3.3 Creditor Turnover Ratio = Credit Purchases / Avg. Purchases
2.7.3.4 Inventory Turnover Ratio = Net Sales / Total Assets
Average of Stock / Debtors / Purchases is calculated by ⇒
(opening of first year + closing of last year) / 2
3. Taxes
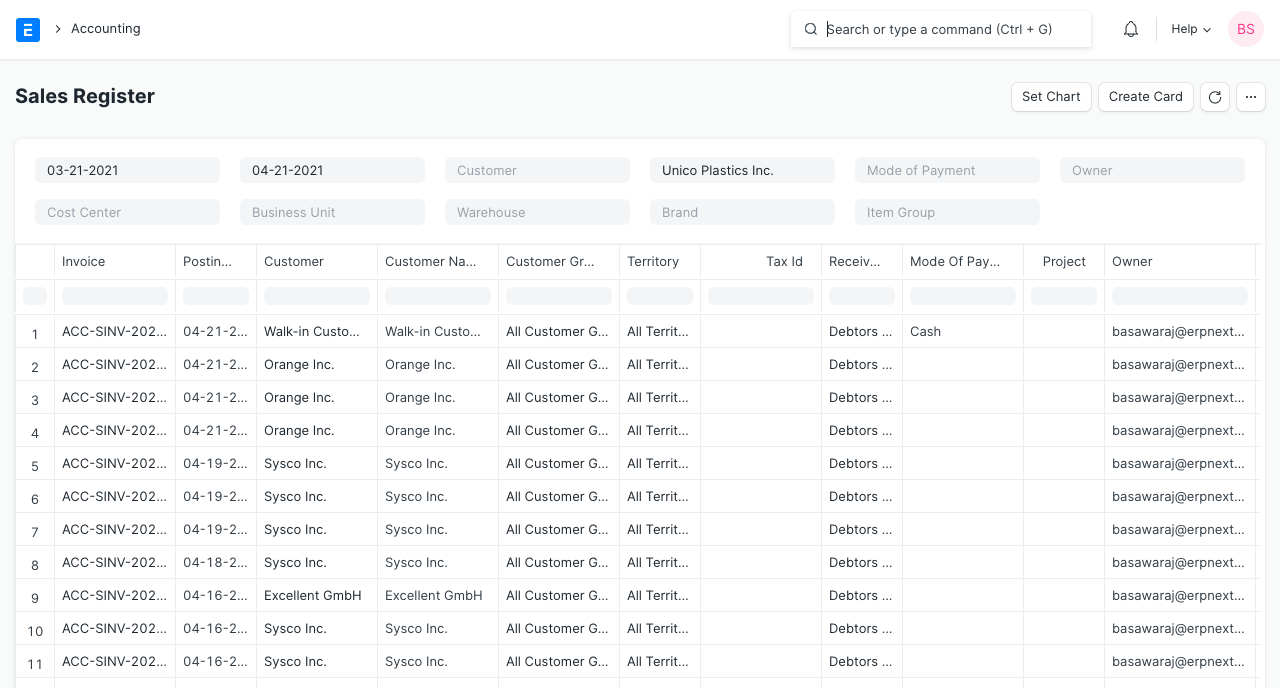
3.1 Sales and Purchase Register
Go to: Accounts > Taxes > Sales Register or Purchase Register.
The Sales and Purchase Register report shows all the Sales and Purchase transactions for a given period with invoiced amount and tax details. In this report, each taxes has a separate column, so you can easily get total taxes collected / paid for a period for each individual tax type, which helps to pay the taxes to government.
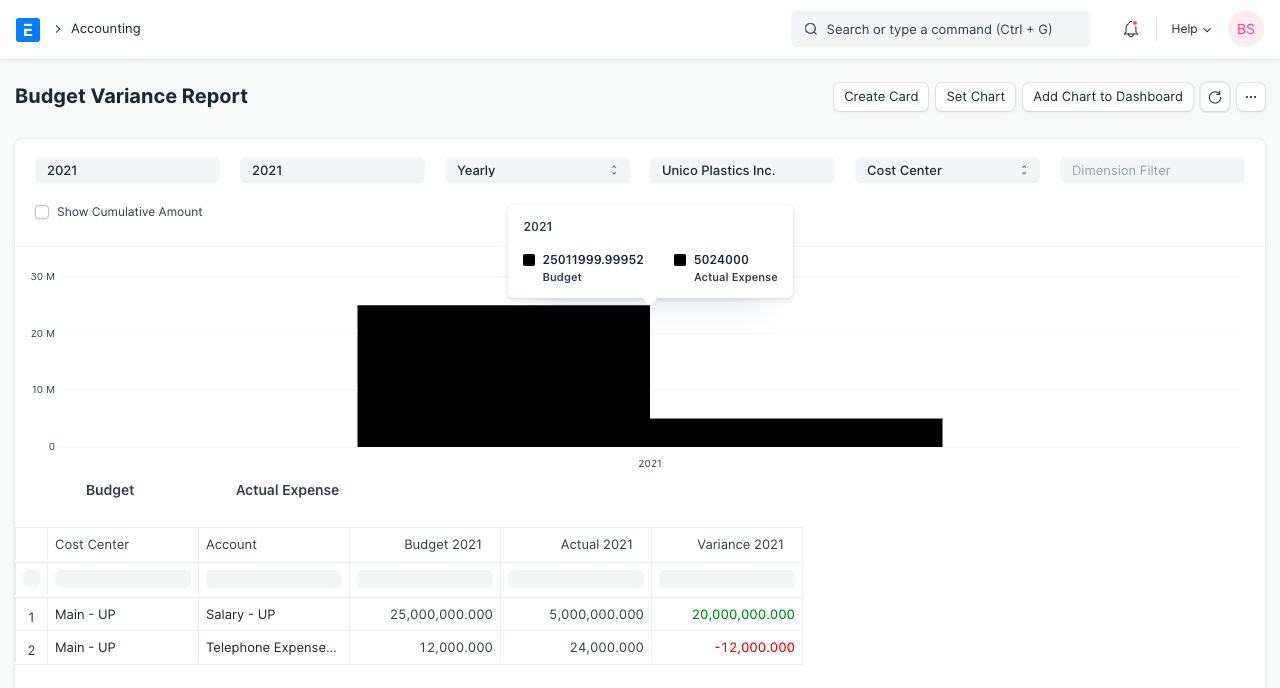
4. Budget and Cost Center
4.1 Budget Variance
Go to: Accounts > Budget and Cost Center > Budget Variance Report.
In ERPNext, you can assign expense budget for an expense account against any specific cost center. This report gives a comparison between budgeted and actual expenses and the variance (the difference between the two) in monthly / quarterly / yearly view.
5. Tax reports for India
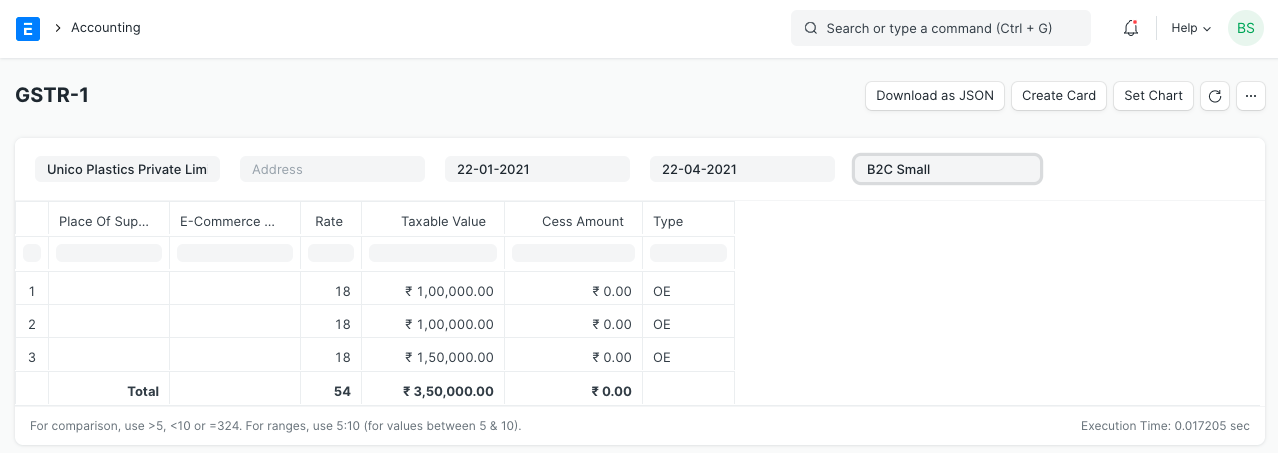
5.1 GSTR-1 (India)
Go to: Accounts > Goods and Services Tax (GST India) > GSTR-1.
The GSTR-1 report helps Indian users to file monthly return of outward supplies. This report shows all the sales transactions of the company in Govt specified format. The output of the report is changed based on the selected type of business (B2B, B2C Large, B2C Small, CDNR and Export).
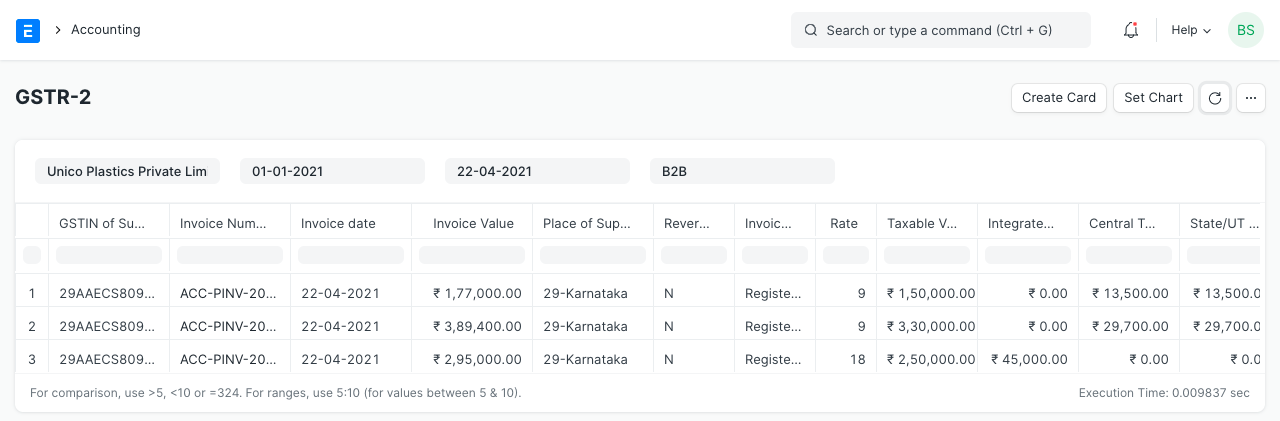
5.2 GSTR-2 (India)
Go to: Accounts > Goods and Services Tax (GST India) > GSTR-2.
The GSTR-2 report helps Indian users to file monthly return of inward supplies. The report gives the details of all inward supplies of goods or services received during a month, in Govt specified format.
6. Analytics
6.1 Item wise Sales and Purchase Register
Go to: Accounts > Analytics > Item-wise Sales Register or Item-wise Purchase Register.
The Item Wise Sales and Purchase Register report shows all the Sales and Purchase transactions for a given period with item rate, quantity, amount and tax details. In this report, taxes has a separate column, so you can easily get individual taxes for each individual item. From this report you can have a look of which items are sold or purchase most.
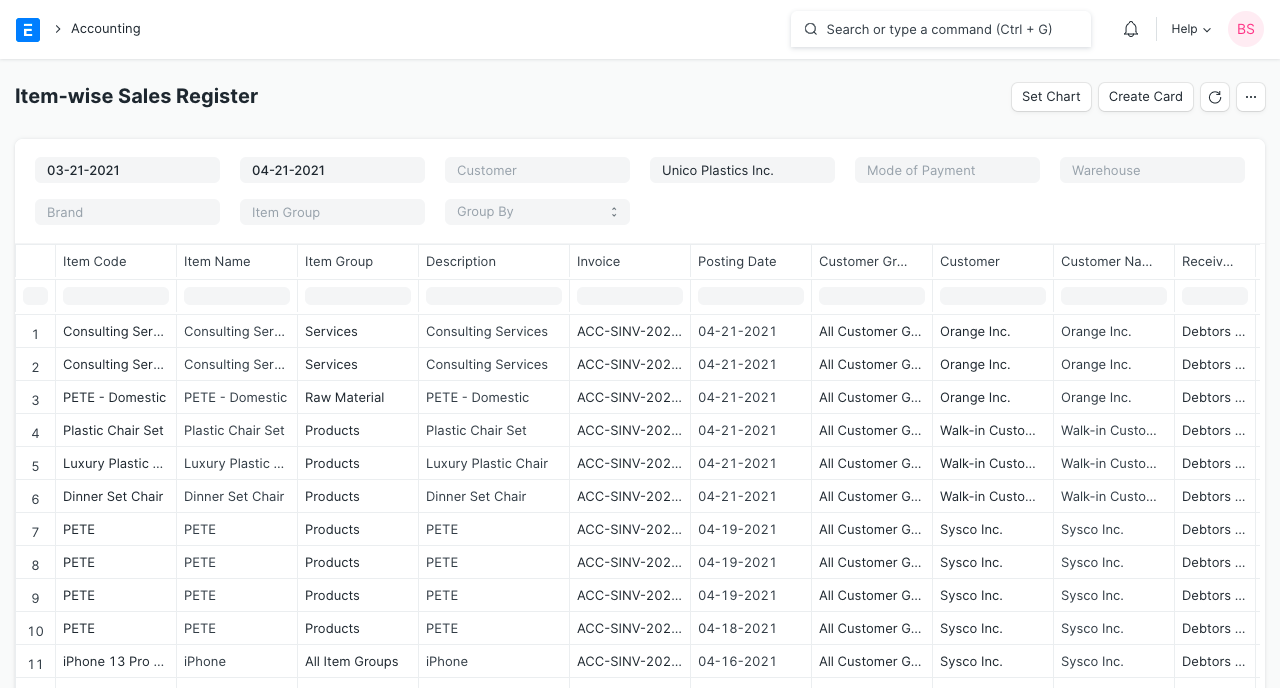
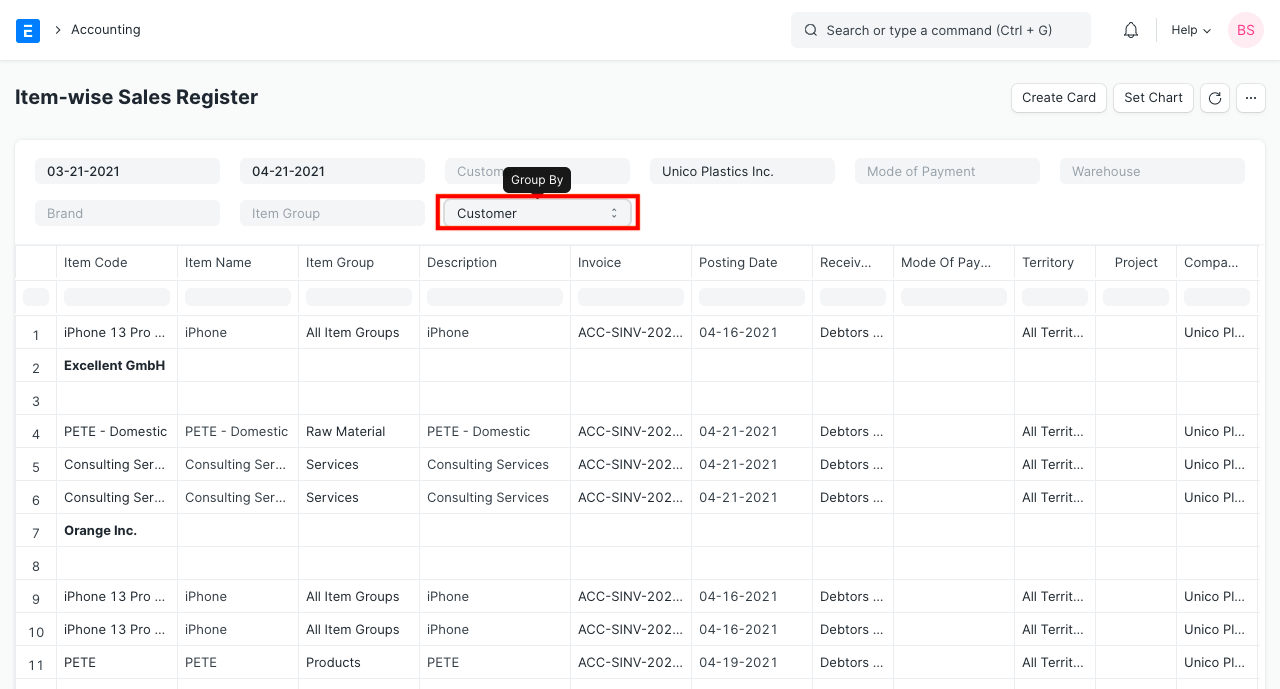
More detailed analysis can also be done by using the 'Group By' filter which gives sales data for a specific Customer, Supplier, Territory, etc. You can find out which Item is more popular in which region or which Customer is buying which Item more.
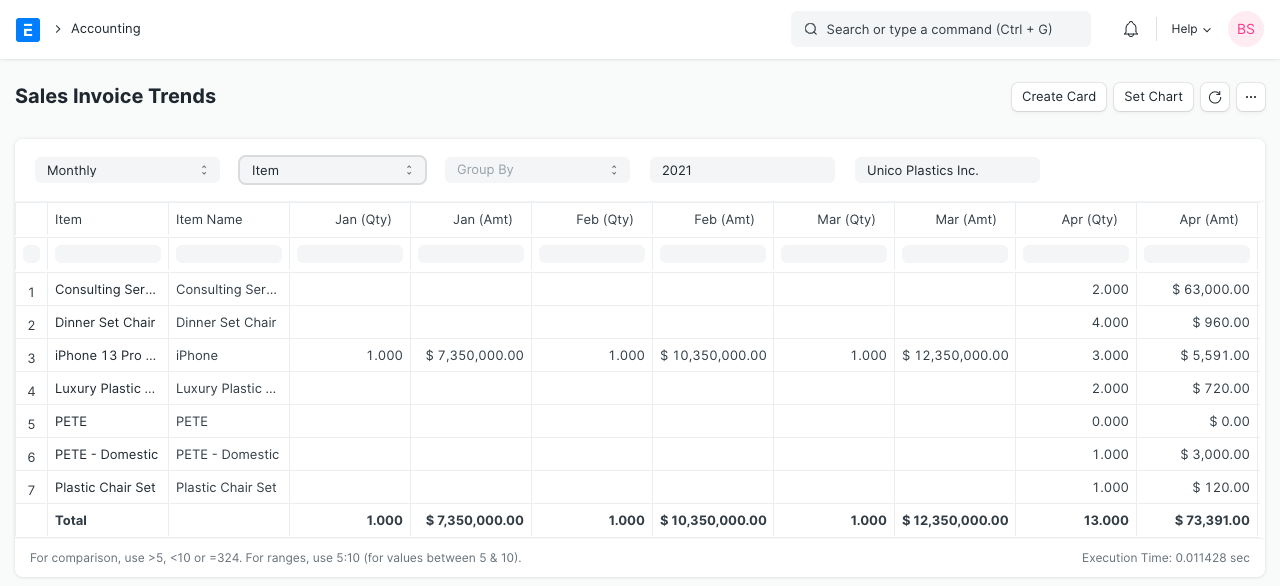
6.2 Sales or Purchase Invoice Trends
Go to: Accounts > Analytics > Sales Invoice Trends or Purchase Invoice Trends.
Another very useful report is invoice trends, From this report you can easily get the trending items on monthly, quaterly, half yearly or yearly basis. You will get the idea of sales and purchase both in quantity and amount.
7. To Bill
- Ordered Items To Be Billed: The report shows the items which has been ordered by customers, against which Sales Invoice has not been created / partially been created.
- Delivered Items To Be Billed: The items which has been delivered to the customers, but Sales Invoice has not been created / partially been created.
- Purchase Order Items To Be Billed: The report shows the items which has been ordered from the suppliers, but Purchase Invoice has not been created / partially been created.
- Received Items To Be Billed: The items which has been received from the suppliers, but Purchase Invoice has not been created / partially been created.
8. Other Reports
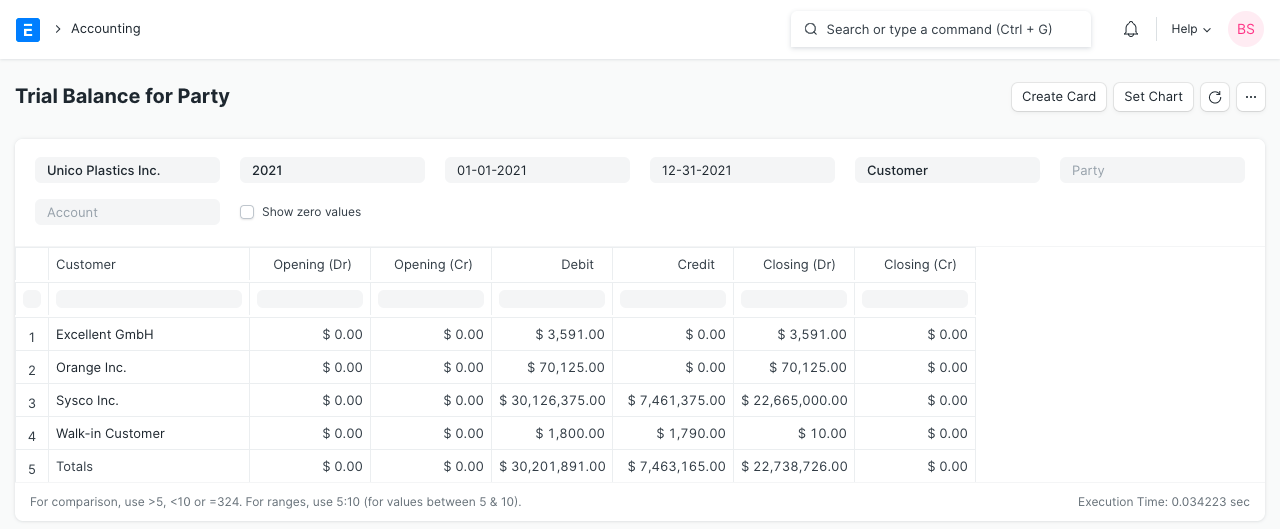
8.1 Party Wise Trial Balance
Go to: Accounts > Other Reports > Trial Balance for Party. Usually you might need to see the trial balance for your customesrs and suppliers. You can easily get for all of your customers or suppliers and also for individual.
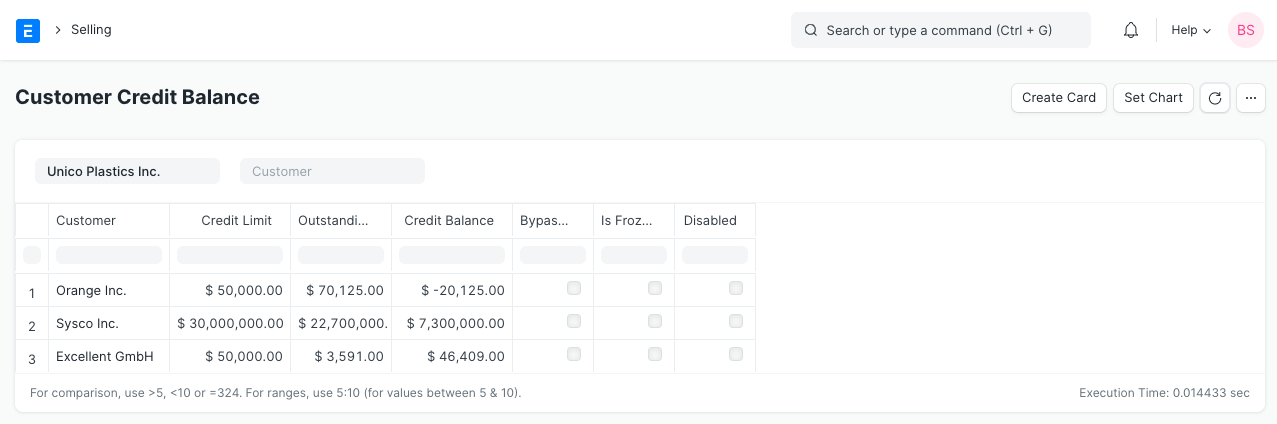
8.2 Customer Credit Balance
The report shows the credit limit, outstanding and credit balance for each customer.